 |
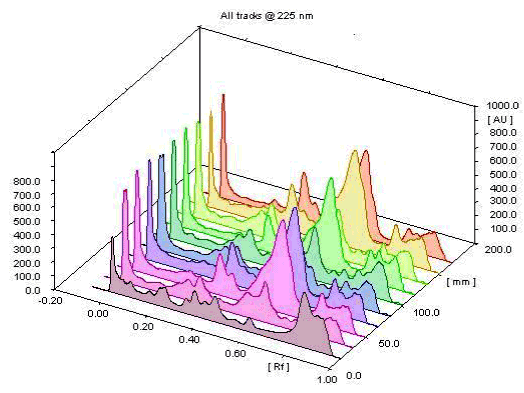
| Figure 2: Example of a 3D densitometric chromatograms at 225 nm obtained from HPTLC analysis of commercial extracts of bearberry. Each profile, as sequence of peaks similar to those of HPLC, corresponds to a track where the intensity of the spots can be appreciated and measured in order to obtain a quantification of the separated substances. |