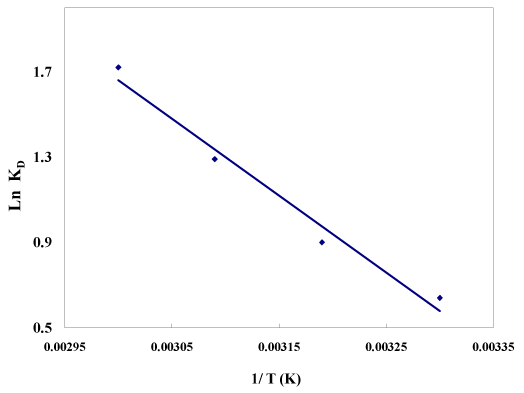
Figure 10:
Van’t Hoff plot of lnK
D
versus 1/T.