|
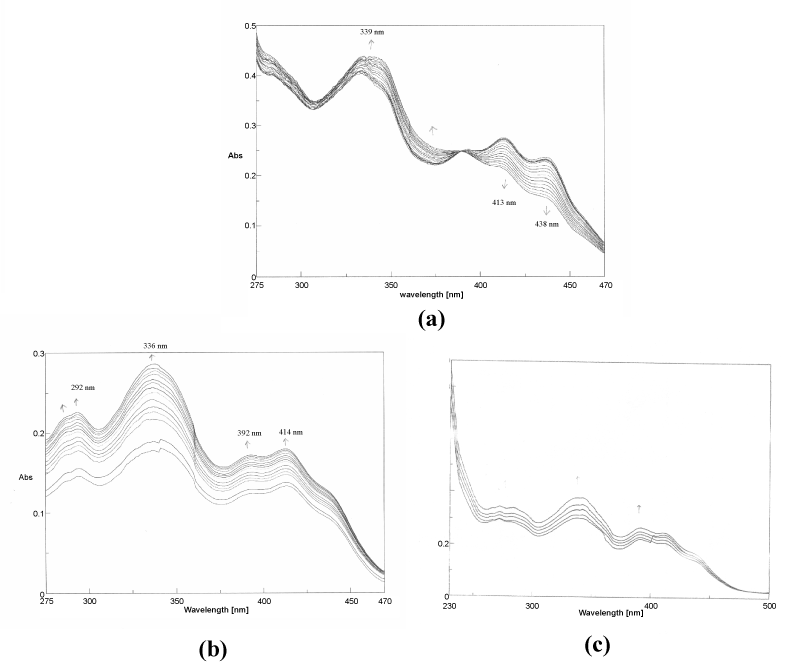
| Figure 10: (a) Absorption spectral changes recorded at 10 min interval for the reaction between 3 (0.43×10⁻⁴ M) and NaBH4 (1.71×10⁻⁴) in CH3OH at 320 K; (b) similar data recorded at 2 min interval for the reaction between 3 (0.12×10⁻⁴ M) and K3[Fe(CN)6] (0.13×10⁻⁴ M) in CH3OH–H2O 3:1 v/v at 320 K; (c) similar data recorded at 16 min interval for the reaction between 3 (0.1×10⁻⁴ M) and Me3N→O (0.7×10⁻⁴ M) in CH3OH at 323 K. |