 |
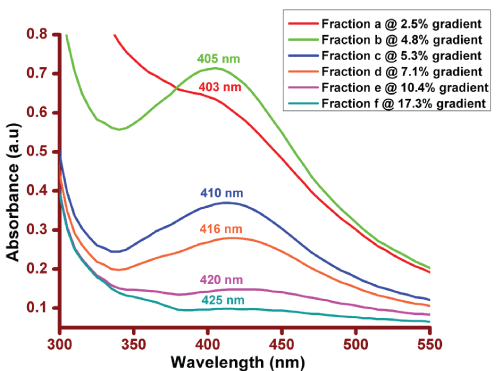
| Figure 4 :UV-Vis spectroscopy measurements of the various pooled fractions a, b, c, d, e and f sedimented at sucrose gradients of 2.5%, 4.8%, 5.3%, 7.1%, 10.4% and 17.3% respectively. The individual samples and their surface plasmon peak are labeled. |