 |
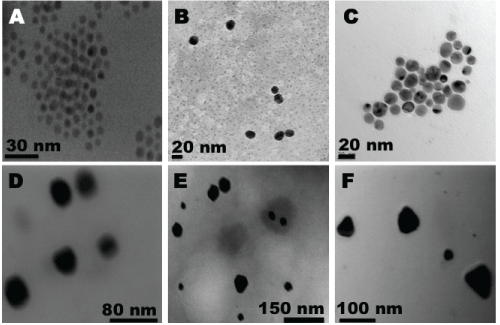
| Figure 5 :Transmission electron microscopy images of the various pooled fractions; A, B, C, D, E and F upon sedimentation using sucrose density gradient at 2.5%, 4.8%, 5.3%, 7.1%, 10.4% and 17.3% respectively, following separation of the anisotropic silver nanoparticles. |