 |
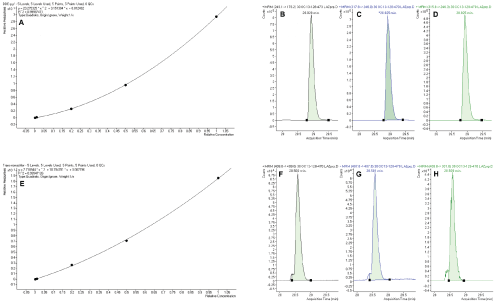
| Figure 2: Example calibration curves and MRM qualifiers for real samples. A) Response relative to internal standard plotted as a function of concentration relative to internal standard for: 4,4’-DDE (quadratic calibration curve); B-D) ion chromatograms for 4,4’-DDE quantifier MRM (m/z 246→176) and two qualifier MRM transitions (m/z 318 → 246 and m/z 316→246), respectively, for bald eagle sample 3; E) Response relative to internal standard is plotted as a function of concentration relative to internal standard for: trans-nonachlor (quadratic calibration curve); F-H) ion chromatograms for trans-nonachlor quantifier MRM (m/z 409→409) and two qualifier MRM transitions (m/z 407→407 and m/z 409→302), respectively, for bald eagle sample 3. Note that this analysis made use of the described improvements of back flushing on a T-union joined chromatographic column as well as the commercial QuEChERS tubes. |