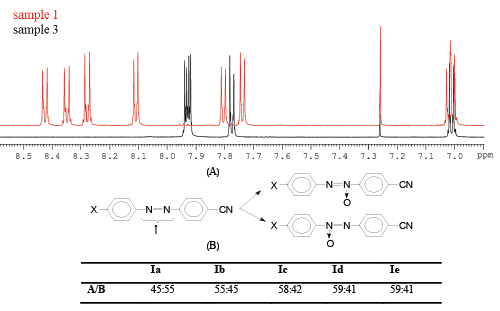
Figure 3:
Parts of
1
H NMR spectra (region of resonance of aromatic protons) of azo- (sample 3) and azoxybenzene (sample 1); the ratio of isomers in the cases of Ia-e as derived from the NMR data.