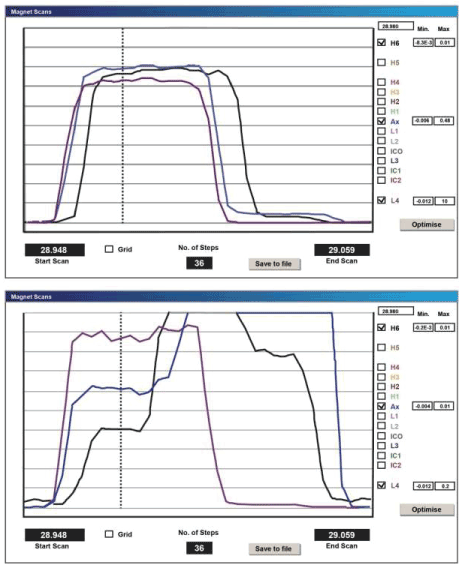
Figure 1:
Analysis of Si. Top: 400 ppb of Si natural; L4- 28Si (purple), Ax- 29Si (blue), H6- 30Si (dark). Bottom: 10 ppb of Si with interferences. Intensities for each ion are shown in small boxes against every Faraday cup.