|
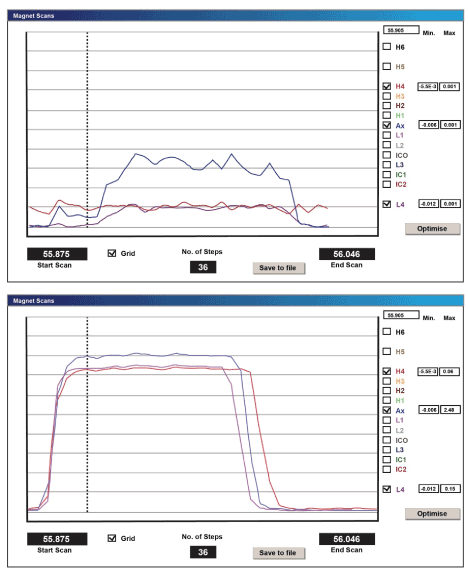
| Figure 3: Analysis of Fe. Top: 400 ppb of Fe natural; L4- 54Fe (purple), Ax- 56Fe (blue), H3- 57Fe (orange). Bottom: interferences. Intensities for each ion are shown in small boxes against every Faraday cup. Interferences are given on the scale of 0.001 V, which is magnified 100−1000 times compared to the standard. |