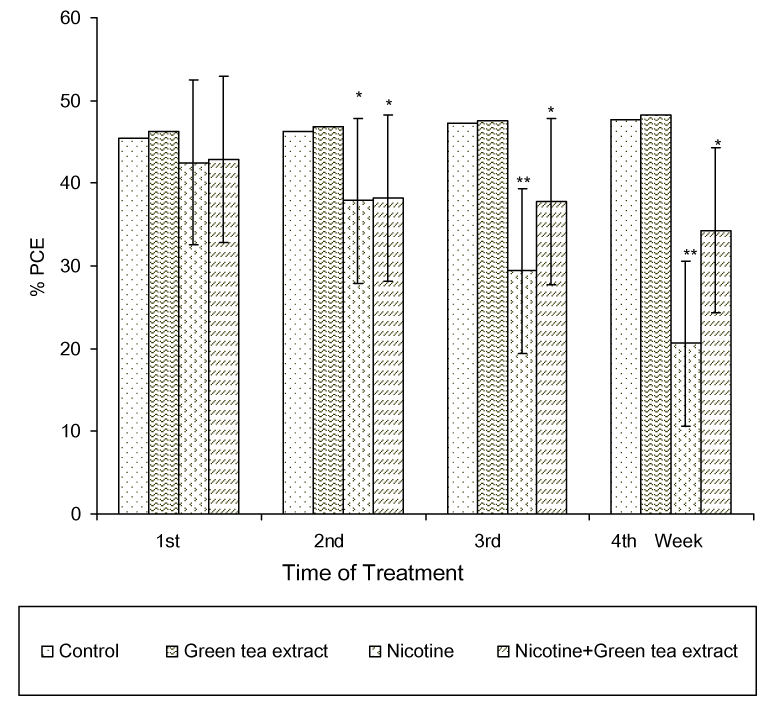
In each group, twenty animals were used, five animal for each studied week. Data are represented as mean. (P< 0.05) is significant (*) and (P< 0.01) is highly significant (**): Comparison takes place between control and nicotine group and /or between nicotine group and nicotine-green tea extract group.