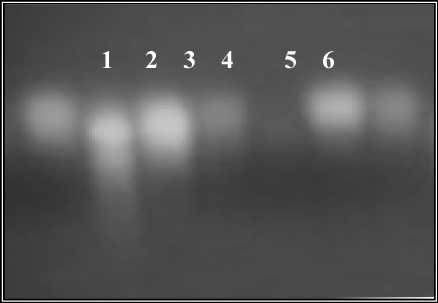
Figure 1:
Agarose gel electrophoretic pattern: Liver DNA (1: control); 2: (2.5% grilled fat); 3: (5% grilled fat); kidney DNA (4: control); 5: (2.5% grilled fat) and 6: (5% grilled fat).