 |
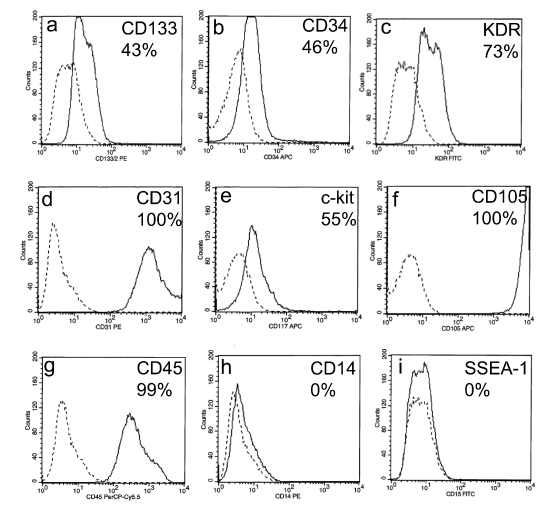
| Figure 2: Representative histogram overlays plot figures for flow-cytometric analysis of cell surface marker expression on clonally isolated cultured hEHPCs. Histogram plots are shown with the control (unstained cells) in dotted line and the specific fluorescent signal in solid line overlay. hEHPCs express CD133, CD34, KDR, CD31, CD117, CD105 and CD45 but do not express CD14 and SSEA-1. |