 |
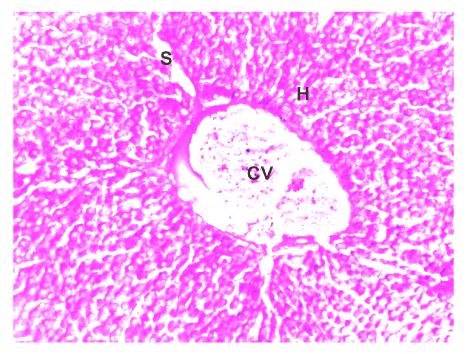
| Figure 17: Light photomicrography of liver of rat after eight weeks of exposure to Cd Cl2 and Zncl2, showing marked increased in PAS reactions in different of the liver .N.B; Central vein (CV). Hepatocytes (H).Blood sinusoid (S). Periodic acid-Schiff’s X 200. |