|
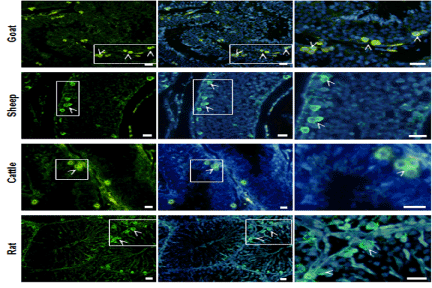
| Figure 3: Comparative immunohistochemical analysis reveals cell surface germ cell marker THY1, in goat, sheep, cattle and rat. Left and middle panel shows THY1 staining and merge of THY1 and DAPI, respectively. Right panel shows the marked area in the middle panel with higher magnification. White arrows represent germ cells. Rats were taken as positive control according to the data sheet for the THY1 antibody. Bar= 50 µm. |