 |
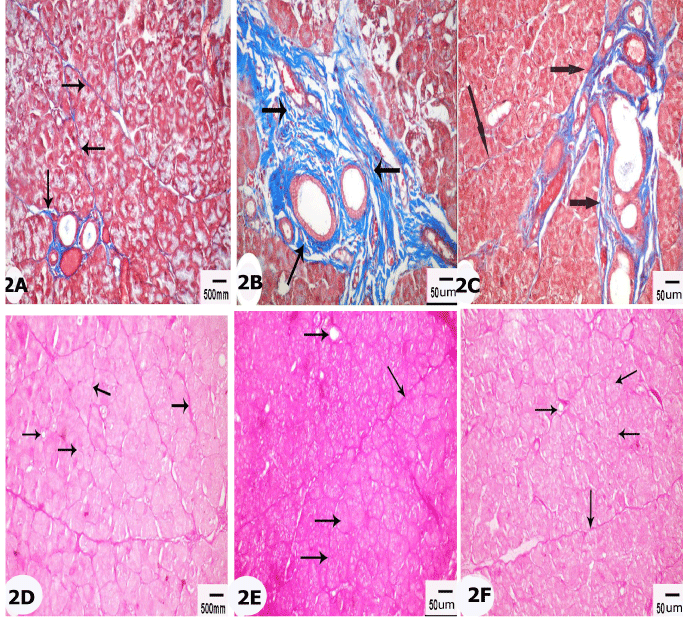
| Figure 2: MT stained sections showing blue stained collagen fibers (arrows) in between the lobules, around interlobular ducts and blood vessels in control subgroup Ia (Figure2A), group II (Figure 2B) and group III (Figure 2C) X200. PAS stained sections showing positive magenta red PAS reaction in the cytoplasm and basement membrane of acinar and ductal cells (arrows) in control group (Figure 2D), strong reaction in group II (Figure 2E) and decreased reaction intensity in group III (Figure 2F) X200. |