 |
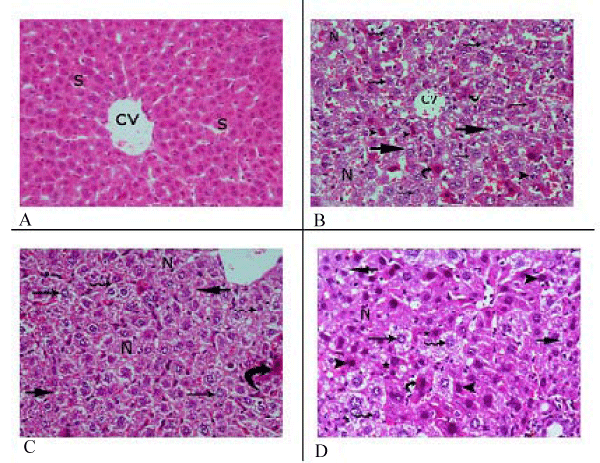
| Figure 7: Section of liver (A) control animal showing normal structure of hepatocyte lobule: central vein (cv), sinusoid (s). (B) 50 mg/kg PEG treated animals showing signs of degeneration in the form of pyknosis (arrow), vacuolation (solid arrow) and necrosis (N) of hepatocytes, and eosinophilic cytoplasm are present in some of hepatocytes (curved arrow). (C): 100 mg/kg PEG treated animal showing ballooning degeneration, signs of vacuolation (solid arrow), necrosis foci (N) and different forms of nuclear degeneration (binucleation, karyolysis (thine arrow) and karyorrehexis (wavy arrow), eosinophlic cytoplasm (curved arrow). (D): 200 mg/kg PEG treated animals showing sever damage; hepatic cells have focal necrosis N, pyknosis (arrow head), polymorphism, karyolysis (thine arrow), easinophilic cytoplasm (curved arrow) and signs of degeneration of hepatocytes. |