|
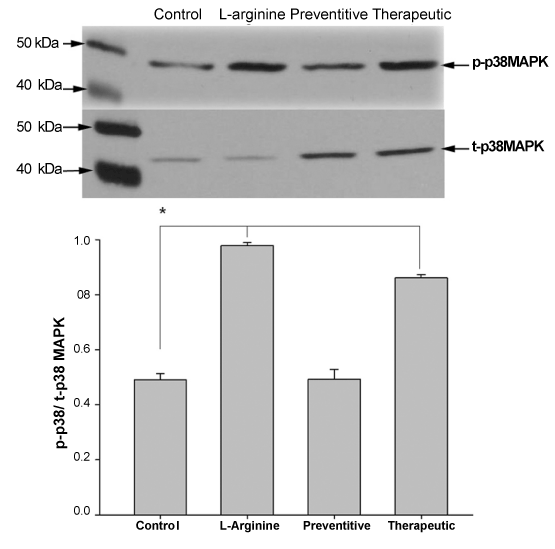
| Figure 2: Western blot analysis of phopho- and total-p38MAPK. Control and treated kidneys were homogenized in buffer and subjected to sodium dodecyl sulfate-polyacrilamide gel electrophoresis and Western blotting. Bars represent mean ± SEM of phospho-p38MAPK/total p38MAPK levels (n=10). * versus L-arginine-given and therapeutic; p<0.05. |