 |
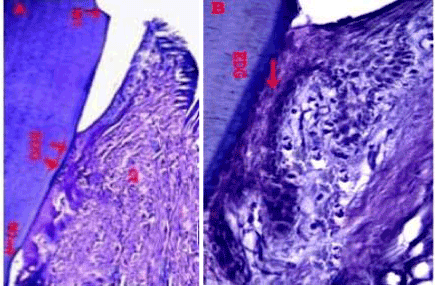
| Figure 5: a) Histopathology of control treated group section showing epithelial down growth along the root surface (EDG) , connective tissue adhesion ( CT) ,with no bone formation (H&E .OMX40). b) High power of epithelial down growth (EDG) N1, N2 (reference notches) (H&E, OMX100). |