|
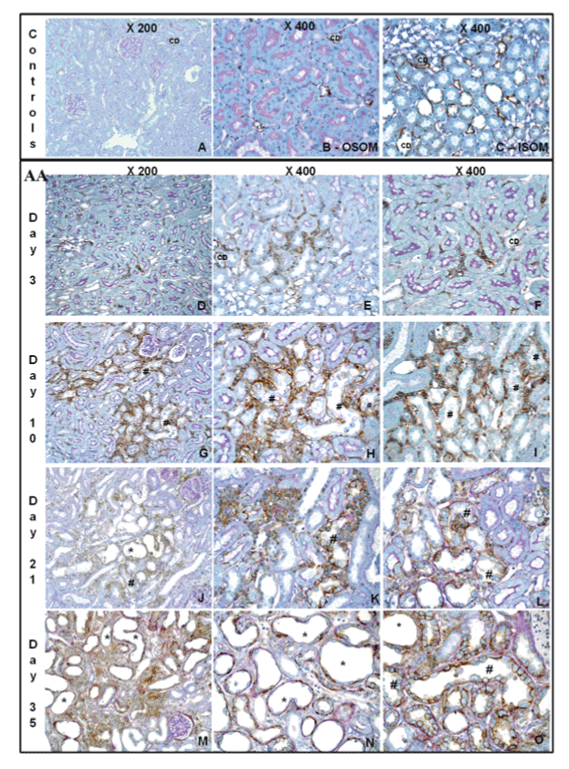
| Figure 4A: Time course of CD44 expression. Representative photomicrographs of CD44 in renal tissue of control rat (A=Cortex-OSOM, x 200; B=OSOM x400; C=ISOM, x400) or AA-treated rats in OSOM at days 3 (D x200; E-F x400), 10 (G x200; H/I x400), 21 (J x200; K/L x400), and 35 (M x200; N-O x400). CD= collecting ducts; *=Atrophic tubules; #= necrotic proximal tubular epithelial cells. |