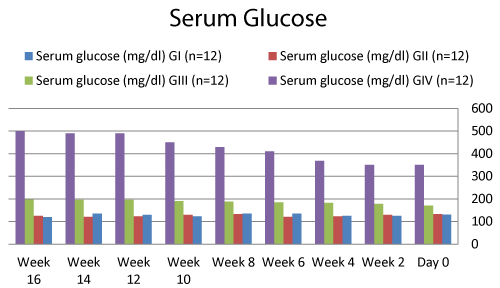
Figure 1:
Graph of serum glucose in the studied four groups.