|
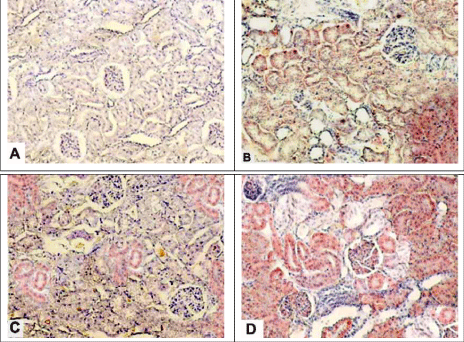
| Figure 8: Photomicrographs of renal specimens showing more qualitatively extensive glomerular and tubular fatty infiltration (dark red stained epithelial cells) as well as a quantitative accumulation in group IV animal (D) as compared to a group II one (B). Renal specimen of a group III rat (C) showed mild or minimal quantitative and qualitative fatty infiltration (faint red stained tubular lining) while that of control rat (A) was devoid of the fatty infiltration (Oil red stain x100). |