|
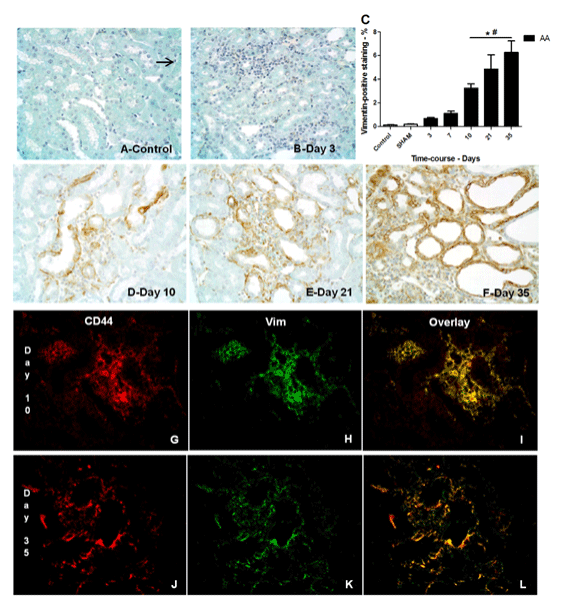
| Figure 6: Representative photomicrographs of vimentin (x400) in renal tissue of control rat (A, arrow) or AA-treated rats at days 3 (B), 10 (D), 21 (E), and day 35 (F). Semiquantitative analysis of vimentin-positive staining in control, SHAM- or AA-treated rats at different time-points after treatment (C). Double immunostaining (x400) for CD44 (red (G-J)) and vimentin (green (H-K)) in AA-treated rats at day 10 (overlay I) and day 35 (overlay L). *p ≤ 0.05 versus SHAM; #p ≤ 0.05 versus control |