 |
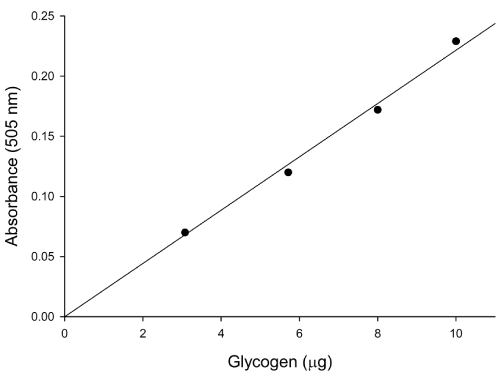
| Figure 1: Representative standard curve for glycogen. In each experiment, different amounts of glycogen (50, 100, 150 and 200 μg) were hydrolyzed. The values of glucose at each point were used to calculate the amount of glycogen in the sample (R2=0.99). |