 |
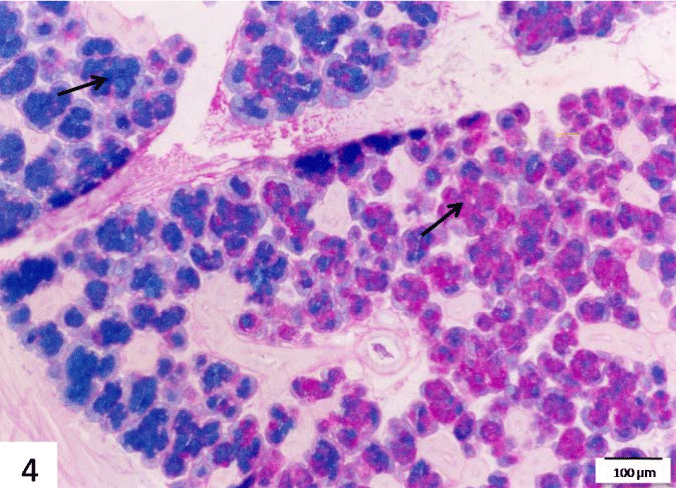
| Figure 4: A section in the submandibular gland of the control group stained with Alcian blue-PAS stain showing marked variation in the distribution and intensity of both PAS and Alcian blue positive material (arrows) in different regions of the gland and even in the same lobule or secretory units. Scale bar=100 μm. |