|
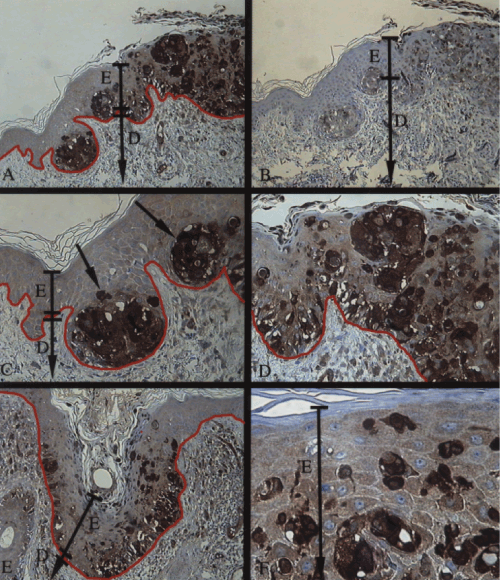
| Figures 2A-2F: shows the immunohistochemical detection of DTdiaphorase in invasive malignant melanomas of the skin: Figure 2A: very strong expression of DT-diaphorase in malignant melanoma cells invading the dermis (red line separates epidermis (E) from dermis). Figure 2B: negatif control of Figure 2A. Figures 2C-D: another sample showing dermal infiltration of malignant melanoma cells, low (Figure 2C) and high magnification (figure 2D). A section of an hair follicle is shown (arrow). Figure 2E: another sample showing the strong expression of DT-diaphorase in cancer cells clusters invading the dermis (D). Figure 2F: strong expression of DT-diaphorase in malignant melanoma cells in the dermis (high magnification). Endothelial lining of dermal capillaries (arrows) also shows strong DT-diaphorase expression. |