 |
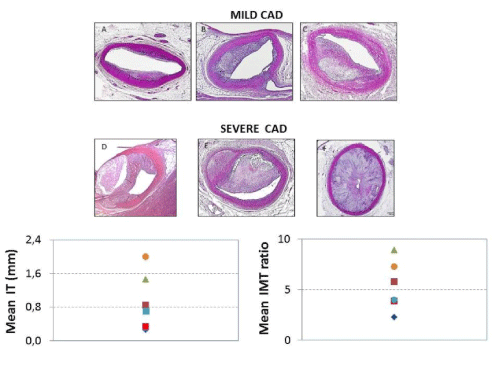
| Figure 2: Top panels: Most severe coronary atherosclerotic lesion of each HCD case: pre-atheromas (A, B), type IV initial atheromas (C), fibrofatty (D) and fibrocalcific (E, F) atheromas (H&E, 2X original magnification). Bottom panels: Inter-animal range of Mean IT and Mean IMT ratio. Mild and more severe CAD cases can be identified based on these two parameters as well as on the incidence of atheromas, as reported in Table 4. |