|
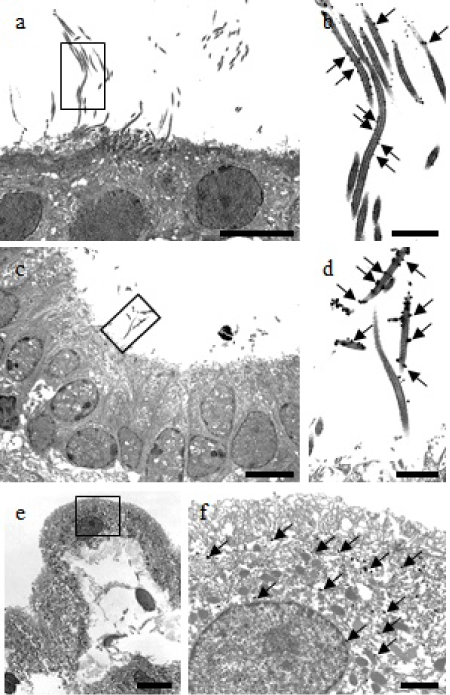
| Figure 2: Immunogold electron micrographs showing ASIC2 localization on the rat ependymal cells in brain (a, b) and spinal cord (c, d), and choroid plexus (e, f). The rectangles in a, c and e are shown at higher magnification in b, d and f, respectively. ASIC2 immunoreactivity is detected as dots (arrows in b, d and f). The reactions are detected on the ciliary membrane in ependymal cells (a-d). ASIC2 expression in choroid plexus is detected in the cell body (e and f). Bars; 10 μm (a, c and e) and 2 μm (b, d and f). |