 |
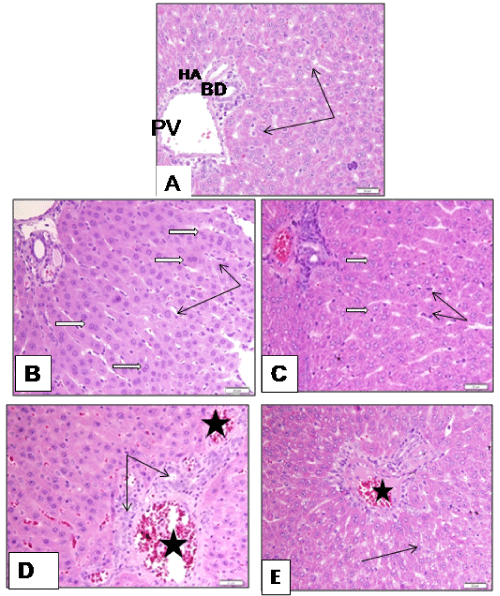
| Figure 2:Sections from rat liver near portal areas showing: (A) Control with normal portal triad portal vein(PV) hepatic artery (A) and bile duct (BD) hepatocytes showed normal architecture regarding arrangement of cytoplasm and nuclear appearance. (B) G2 (8 mg): mild changes with more binucleated cells (white arrows). Von kupffer cells are prominent (black arrows). (C) G3 (8 mg+Mof): hepatocytes appeared to possess more vesicular nuclei (white arrows) still Von kupffer cells appeared prominent ( black arrows). (D) G 8 (150 mg): Portal area showed congestion of blood vessels (stars) and bile duct proliferation ( black arrows). (E) G9 (150 mg+Mof ) : potential improvement was observed still congestion of portal vein (star) and mild microvesicular steateosis (black arrow). |