|
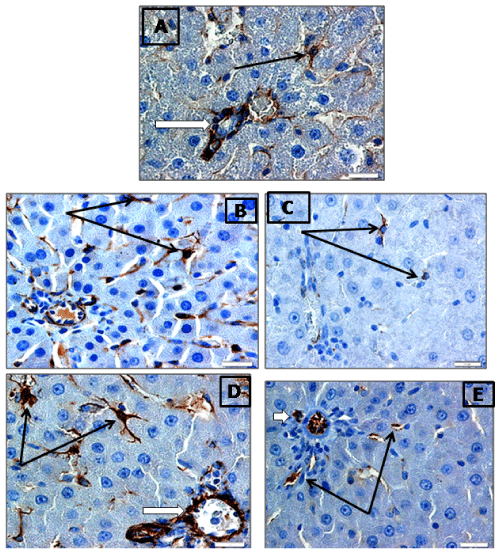
| Figure 6:Sections in rat liver stained immunohistochemistry for desmin near portal area showing: increase in desmin positive cells in both (B) low dose G2 (8 mg/kg) and high dose (D) G8 (150 mg/kg) (black arrows) compared to G1 (control) (A). Perivascular tissue also showed positive staining (white arrows). Administration of Mof (G3 and G9) result in decrease of Desmin positive cells Figs (C and E) compared to treated rats receiving low and high doses of DIC (G2 and G8) . |