|
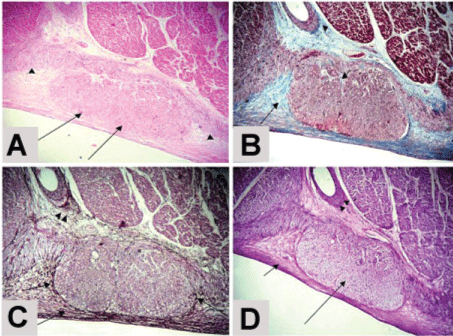
| Figure 2: (A) A photomicrograph of the terminal crest epicardium showing the sinu-atrial node head (arrow), and SAN arms (arrow head) Stain: H& E Obj.x4 : Oc.x10. (B) showing the collagen fibers (arrow), and BV (arrow head) Stain: Green Masson's Trichrome Obj.x4 : Oc.x10. (C) showing the reticular fibers (arrow), and BV (arrow head) Stain: Jone's Methenamine Silver stain Obj.x4 : Oc.x10. (D) showing the strongly PAS positive reaction of subepicardium CT. (short arrow), moderately PAS positive reaction of the SAN (long arrow) and BV (arrow head) Stain: PAS Obj.x4 : Oc.x10. |