|
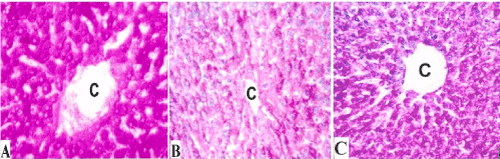
| Figure 6: Photomicrographs of PAS-reacted liver sections showed A: control group with very strong normal reaction, B: ethanol-treated rats with weak reaction, and C: zinc/ethanol-treated rats with moderate-strong reaction indicating the cytoplasmic glycogen content among the three groups. C indicates central vein. (400X, PAS). |