|
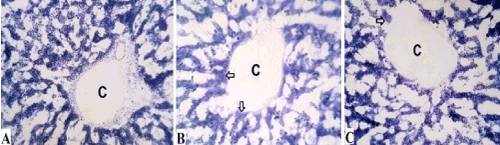
| Figure 8: Photomicrographs of SDH reacted liver sections showed A: control group with strong-positive activity in the form of purple-violet difromazan granules, B: ethanol-treated rats with weak positive activity especially around central veins (C) while zone 2 showed mild activity (granules), and C: Zinc/Ethanol-treated rats with moderate-strong SDH activity while some centrilobular cells appeared negative (arrows) with homogeneously purple cytoplasm that had no SDH granules. (400X, SDH). |