|
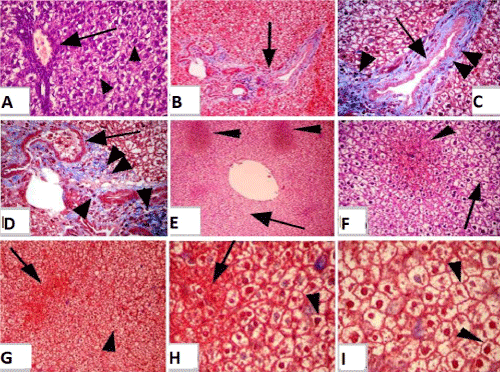
| Figure 2: (a): Section of mature Westar rats liver of exposed group to tartrazine (II) showing thickening of the wall of central vein (arrow) and was surrounded with wide area of necrotic hepatocytes with pyknotic nuclei (arrow head). H&E Obj.x20 : 10X. (b-d): Section of mature Westar rats liver of exposed group to tartrazine (II) (b): showing fibrous connective tissue proliferation in the portal areas (arrow). (c): showing thickening of bile duct (arrow), fibrous connective tissue proliferation around bile duct (double arrow head) and leukocytes infiltrations (single arrow head). (d): showing congested blood vessels (arrow), fibrous connective tissue proliferation around blood vessels (double arrow head) and leukocytes infiltrations (single arrow head).(b-d) Blue Masson’s Trichrome. b) 10X : 10X c,d) Obj.x20 : 10X. (e, f): Section of mature Westar rats liver of exposed group to tartrazine with royal jelly (III) (e): showing small foci of normal homogenous, acidophilic hepatic tissue (arrow head) beside pale, necrotic and degenerated hepatic parenchyma (arrow). (f): higher magnification of Figure e showing the same. (e,f) H&E e) 4X : 10X f) Obj.x20 : 10X. (g-i): Section of mature Westar rats liver of exposed group to tartrazine with cod liver oil (IV) showing the same as in group III. (g): showing foci of normal acidophilic hepatic tissue (arrow) in between necrotic and degenerated pale hepatic parenchyma (arrow head). (h): higher magnification of Figure g showing the same. (i): showing enlarged, vacuolated, pale acidophilic necrotic hepatocytes with pyknotic nucleus (arrow head). (g-i) Blue Masson’s Trichrome. g) 4X : 10X (h,i) 4X0 : 10X. |