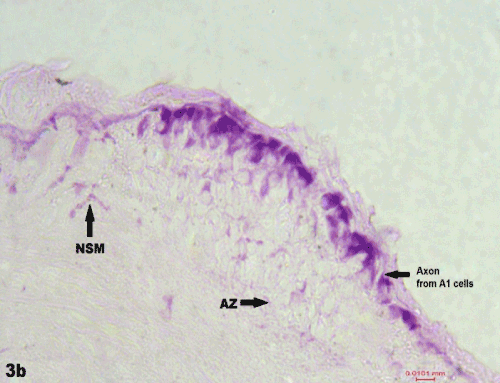
Figure 3b:
Frontal section of cerebral ganglion of
E. eugeniae
showing distribution of AF positive A1 NSCs beneath the perineurium. Note ‘accumulation zone’(AZ) and blood capillaries charged with NSM. 400X.