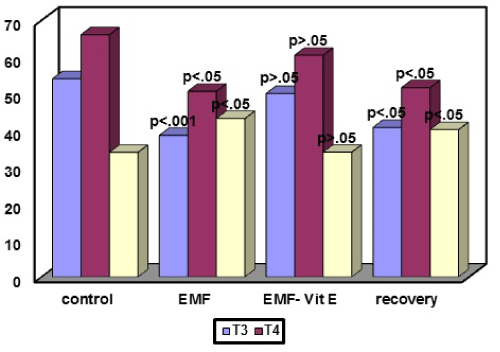
Figure 5:
Shows relatively significant difference in T3, T4 and TSH levels in comparison to exposed and control groups.