|
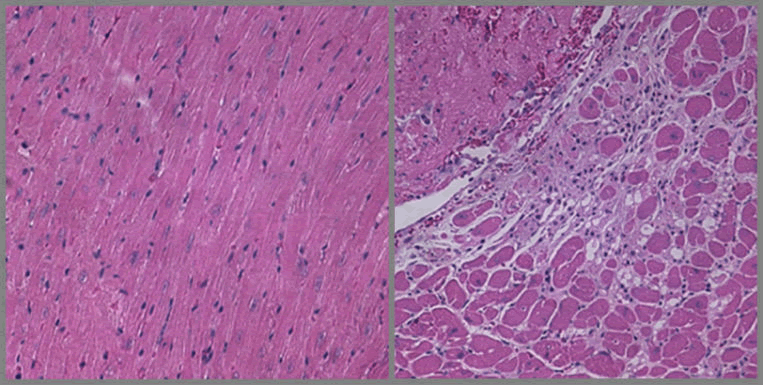
| Figure 7: Allograft cardiac transplantation was performed between apo E-KO mice (recipients) and 129J mice (donors). Representative sections from native (Panel A) and allograft (Panel B) mouse myocardium at 6 days post-transplantation. Infiltration of inflammatory cells in the allograft tissue are shown (arrows). Hematoxylin and eosin stain. Panel A X16; Panel B X25. |