|
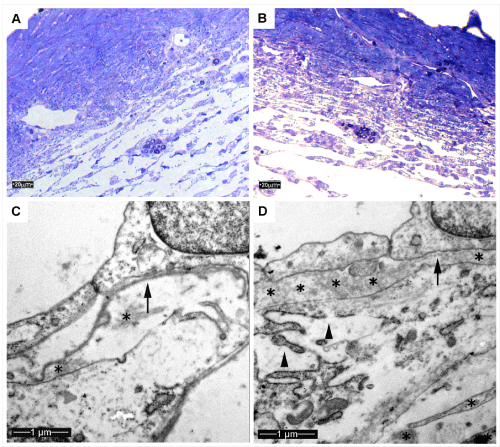
| Figure 2: Control right eye (A, C,) and glaucomatous left eye (B, D) of the same animal. Representative figure including semithin (A and B) and ultrathin sections (C, D) corresponding to the same area. C and D shows a higher magnification of the aqueous vessels from A and B where the internal wall of the JCT are pointed by black arrows.. In C there are more optically empty spaces with less fibrillar material in the subendothelial region and less rough endoplasmic reticulum than in D. Asterisks indicate fibrillar material and elastic network; arrows designate basement membrane, and arrowheads rER cisternae. |