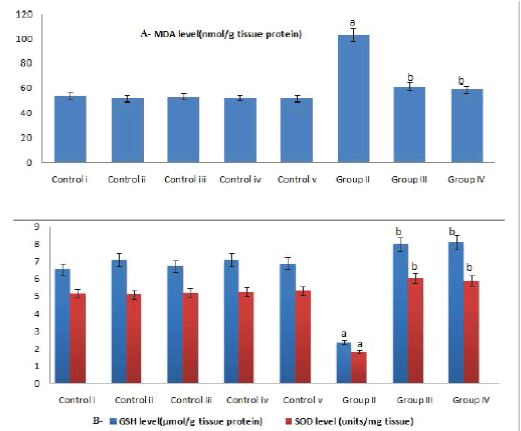
aP = 0.01 vs control group i;
bP< 0.01vs group II, tested by Student “t” test.
MDA: Malondialdehyde; GSH; Glutathione; SOD: Superoxide dismutase.
|
| Non-significant difference between control subgroups tested by one-way ANOVA followed by Post Hoc Tukey’s test. aP = 0.01 vs control group i; bP< 0.01vs group II, tested by Student “t” test. MDA: Malondialdehyde; GSH; Glutathione; SOD: Superoxide dismutase. |
| Figure 4: Measurement of some oxidative stress factors in the different groups studied. |