|
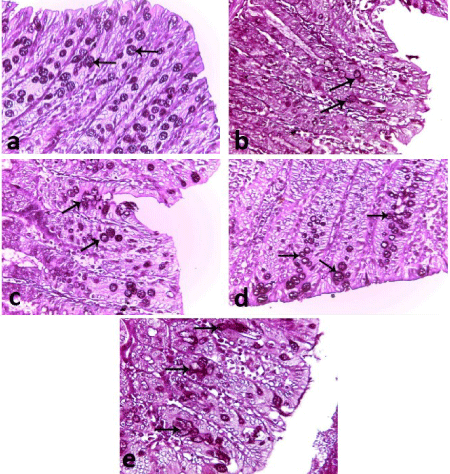
| Figure 5: Photomicrographs of sections in the colon showing (a) control group with large number of goblet cells (arrows) within the intestinal mucosa. (b) Markedly reduced goblet cell number (arrows) in acetic acid colitis group. (c,d,e) Increased goblet number (arrows) in all treated groups, especially in ginger treated group (d) and in NAC and ginger treated group (e). (PAS, 400X) |