|
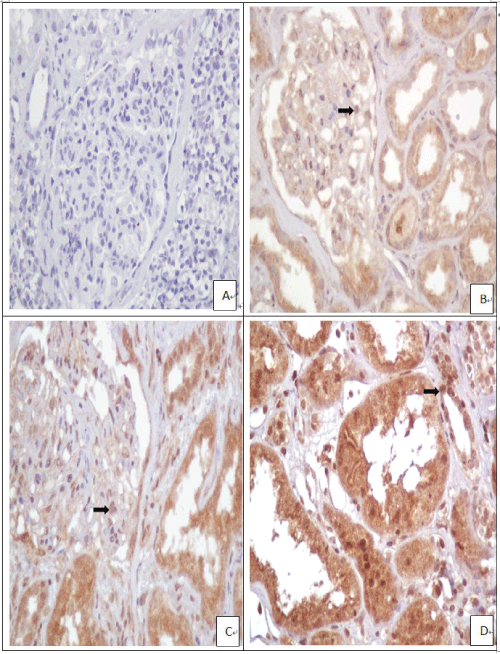
| Figure 1: Representative panels showing different expression intensity of IHC IL-23R stain quantitative grading in glomeruli and renal tubules (IHC stain, × 400). (A) no IHC IL-23R stain in glomeruli and tubules, (B) mild IHC IL-23R stain in normal glomeurli and tubules , (C) moderate IHC IL-23R stain in atrophic glomeruli and tubules, and (D) high IHC IL-23R stain in normal renal tubules. The arrow indicates the IHC stain in a glomerular mesangial cell and renal tubular cell. |