 |
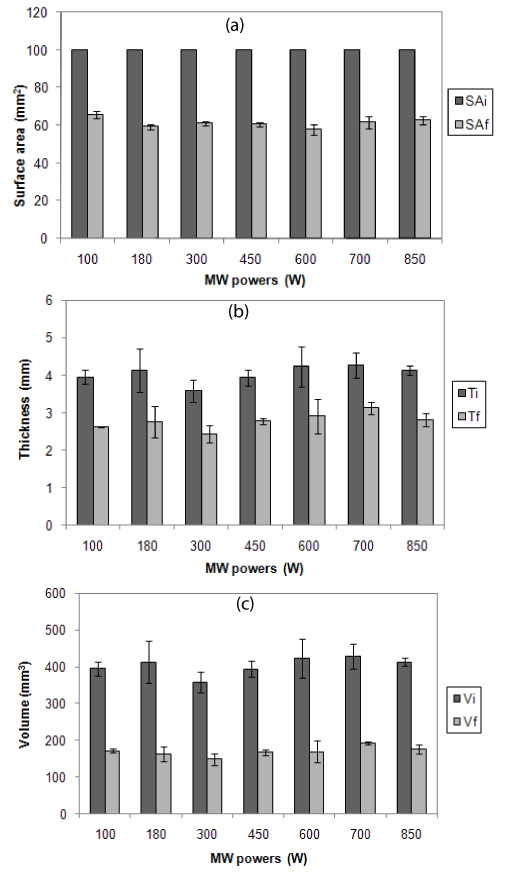
| Figure 2: Effect of MW treatment at different powers on surface area (a), thickness (b) and volume (c) of “Maltaise” orange peel samples; SAi, Ti and Vi: corresponding initial measurements; SAf, Tf and Vf: corresponding final measurements respectively of surface area, thickness and volume. |