 |
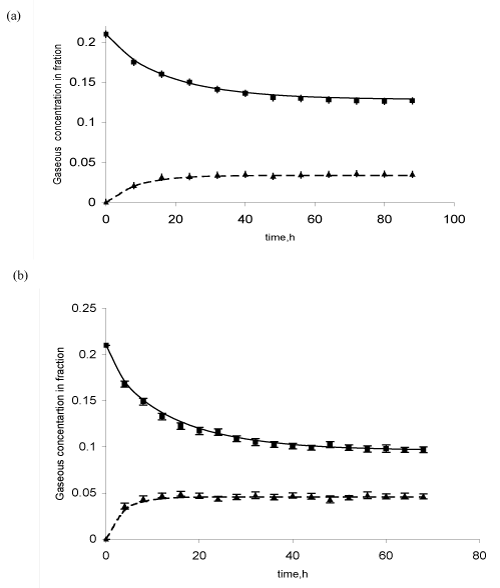
| Figure 4: (a) and (b) Validation of model of packet containing 0.5 kg of capsicum under perforated condition at temperature 5 and 15°C, respectively. (■) symbol denotes observed data for O2 concentration and (▲) symbol for CO2(-) solid line shows the predicted O2 and (--) shows predicted CO2 concentration. Error bar ± SD. |