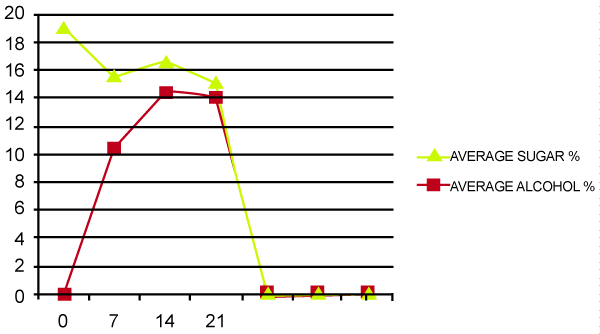
Figure 2:
Average Alcohol % vs Average Sugars Concentration on 7
th
, 14
th
and 21
st
day.