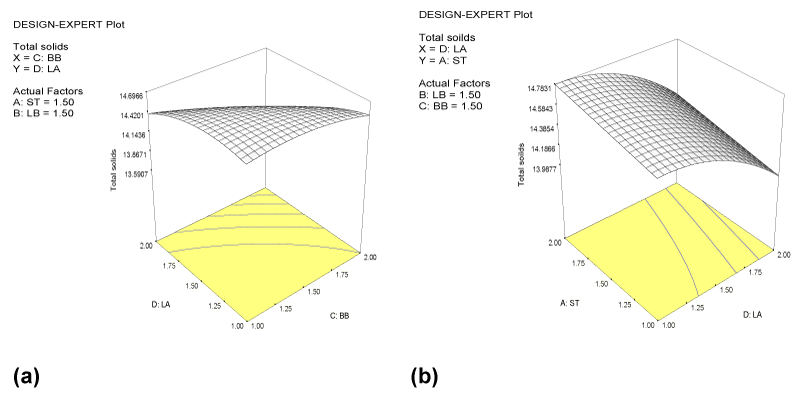
Figure 2:
3-D plots for total solids as a function of
Lactobacillus acidophilus
and
Bifidobacterium bifidus
(a) and
Streptococcus thermophillus
and
Lactobacillus acidophilu
(b).