 |
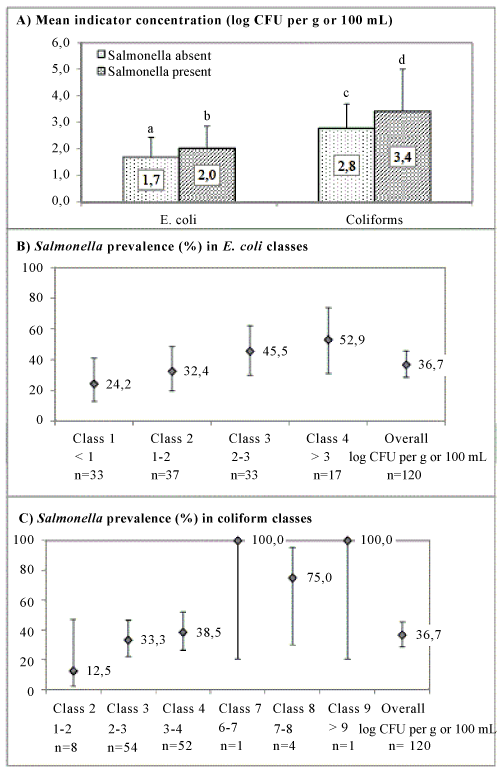
| Figure 2: Mean concentrations of the bacterial indicators in log CFU/g or 100 mL with error bars indicating the standard deviations (A, C, E) and Salmonella prevalence in % with error bars indicating the 95 % confidence interval (B, D, F) are presented for (A, B) different sample types: soil (white bars), water (horizontal striped bars), lettuce (vertical striped bars) and strawberries (black bars), (C, D) different governorates in Egypt: Behira (white bars), Ismailia (horizontal striped bars) and Suez (black bars) and (E, F) different retail types in Egypt: open markets (white bars), shops (horizontal striped bars) and hypermarkets (black bars). Different letters indicate statistically significant differences between factors within one microbiological parameter. |