 |
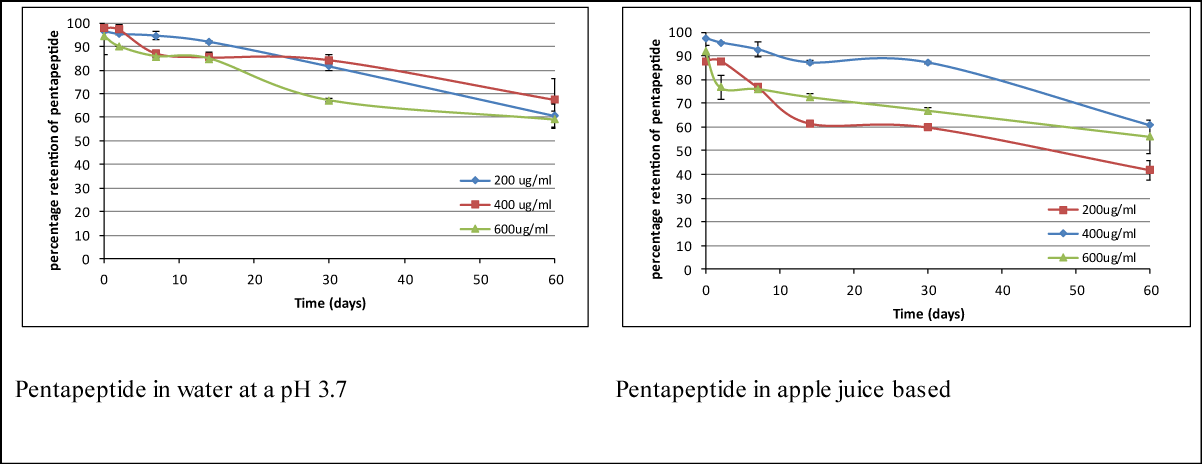
| Figure 2: The stability of varying concentrations of pentapeptide based on the percentage degraded over a storage period (0, 2, 7, 14, 30, and 60 days). The percentage of degradation was calculated using the equation (R2=0.99) derived from standard curve plot. The values are represented as means of replicate analysis ± standard deviation with P value <0.001. |