 |
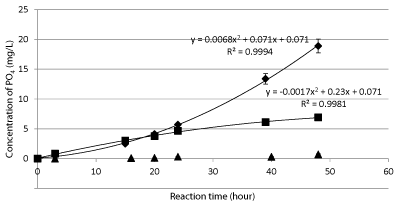
| Figure 2: Changes in the IMPase activity of filter-sterilized enzyme solution (squares), unfiltered enzyme solution (diamonds), or negative control (triangles) over time (bars denote standard deviation of the mean; n=3). Mean values of relative activity indicate a significant (p< 0.05) difference at each hour. The enzyme solution contained 1.4×10² CFU/mL at 24 h and 4.2×10² CFU/mL at 48 h. |