|
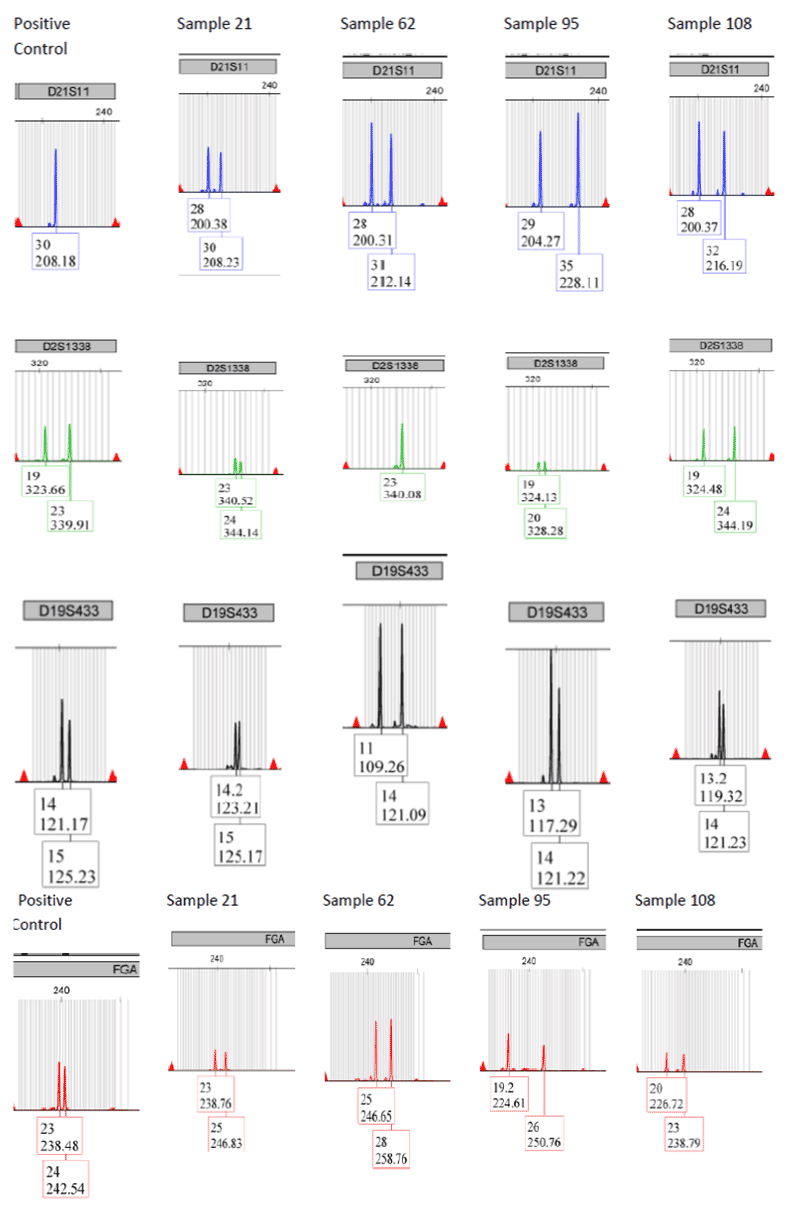
| Figure 1: Electropherograms for the positive control and sample 21, sample 62, sample 95 and sample 108 of the Buganda population showing allele call and DNA size in base pairs (bp) at D21S11, D2S1338, D19S433 and FGA loci. The positive control; a quality control measure in genotyping process illustrates that amplification and genotyping were successful. These loci were highly heterozygous and polymorphic with high discriminating (PD) values and power of exclusion (PE) values. Microvariant alleles were observed at some loci in the Buganda population as shown at D19S433 of sample 21 and FGA of sample 95. The DNA molecules are separated according to their respective sizes. So the smallest fragments are chronologically detected first and if two (or more) fragments have the same size, they are distinguished by the fluorescence color. The use of colors (blue, green, yellow and red) with different diffusivity included in the PCR multiplex, allow distinguishing the overlapping fragments (same size). |