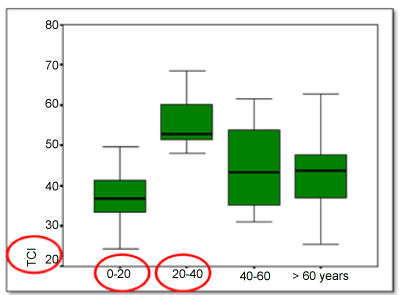
Figure 8:
Bar diagram of TCI.