 |
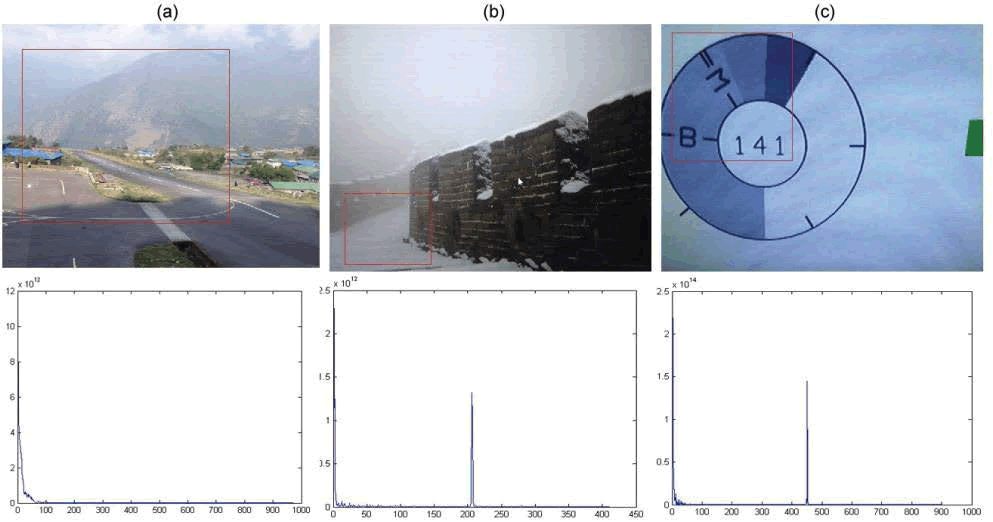
| Figure 5: The image on the left is a natural and non-recaptured image. Pictures shown in middle and on right are re-captured from an LCD screen and exhibit visible traces of aliasing. Corresponding correlation maps generated by Eq. 12 are shown either (θ= 0). Distinctive peaks for the pictures shown in middle and on right are characteristics and signifying the recapturing. Red boxes highlight the analyzed area. |